SUMMARY
Following on from a training and development package prepared and delivered for a leading Power and utilities company, this document has been put together to help identify future opportunities for Remotely Piloted Aircraft (RPAS), in the Power and Utilities sector. We aim to identify other cases around the world where efficiences have been realised by util- ising RPAS technology to improve monitoring of networks.
The original trial for the Power and Utilities company was utilising RPAS technology to help with fault finding and troubleshooting of the current network when outages were no- tified. It is our understanding that this part of the trial hasn’t been as successful as hoped, due to a number of factors, but largely due to the fact that the Drone hasn’t been able to be deployed as regularly as hoped, and that faults haven’t been as prevalent as usual during this part of the season.
OPPORTUNITIES
The opportunties for Drones in the power in- dustry are plentiful. There are situations where drones will allow data to be captured in a more efficient manner, saving time and resources that can be diverted elsewhere. This can be anything from asset inventory calculations, through to asset management and condition reporting, and vegetation management.
It is estimated that power and utilities sector losses related to network outages cost $169 billion globally.
Drones can be used to improve the reliability of supply through condition monitoring, and fault finding on areas where supply and faults may already be identified.
Leveraging additional technologies such as deep learning, and artificial intelligence will enable further savings, cost reductions and efficiences to be realised, thereby enabling better outcomes for both customers, and P&U companies themselves.
REGULATIONS
One of the current challenges preventing Drones from being utilised more regularly in power applications, is the requirement in Aus- tralia to keep the RPA within line of sight of the person conducting the operations. Typically, this limits the radius of operations to 300-400 metres, depending on the person’s eyesight, and size of the RPA itself.
Future iterations of the regulations, namely the manual of standards will allow drones to be operated under what’s called extended visual line of sight (EVLOS)
The updated extended visual line of sight reg-ulations allow for the RPA to be operated up to 1500 metres away from the relevant observer. There are 2 classes of EVLOS operations pro-vided for under the Manual of Standards.
There are additional opportunity sets to be re- alised in power line corridor surveys. Tradition- ally this has been completed by manned fixed wing aircraft and helicopters, combined with satellite imagery in some cases. These aircraft carry expensive LiDAR sensors, and cameras to map, and create a point cloud/mesh of the condition of the network, as well as identify vegetation encroachment areas which could cause network outages.
Drones have the ability to capture a higher quality dataset, generally with more informa-tion per image/scan than traditional methods. Valuable analytics can then be extracted from each asset, whether that be an individual pole, transformer, substation or otherwise.
To this point, the technology has far exceeded the regulations keeping up with the capabilities of the RPA’s. New regulatory processes mean that the potential for Drone technology for longer projects such as corridor mapping is now a real possibility in the power sector.
There are industry estimates that flying Drones BVLOS will cost between $200-$300 per mile, compared to helicopter flights which can average $1200-$1600 per mile, a significant reduction in costs.
OPPORTUNITIES – NETWORK INSPECTION PROGRAMS
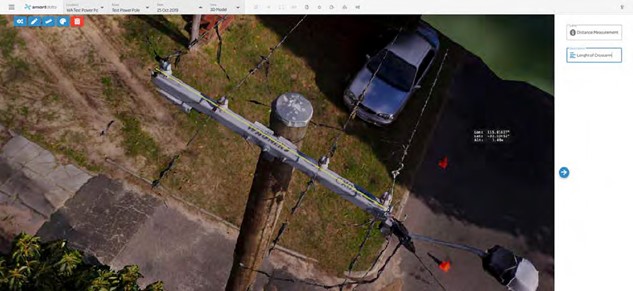
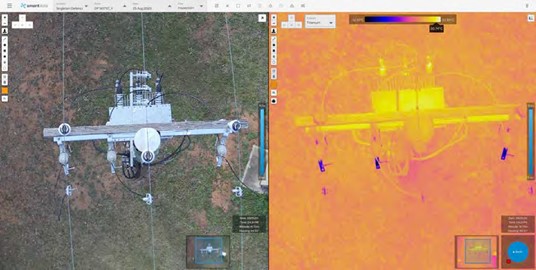
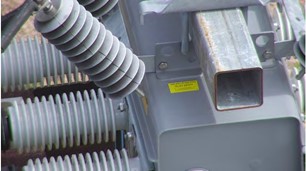
allow the capture of high resolution data such as RGB imagery, thermal imagery, and LiDAR data.Capture from multiple angles of a pole/asset allows the generation of 3D models, useful for mainte- nance planning, situational awareness, and fault finding. An example of a 3D model from a pole in WA is shown below.
Opportunities – Deep Learning And Artificial Intelligence Analytics
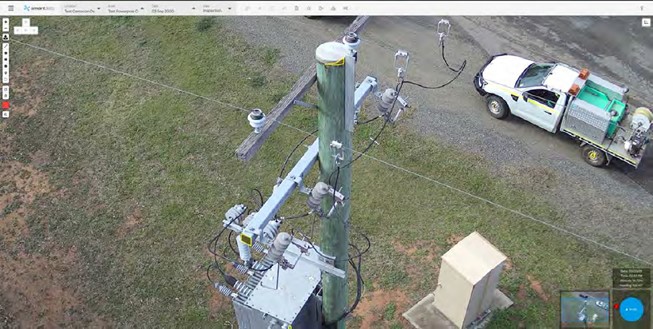
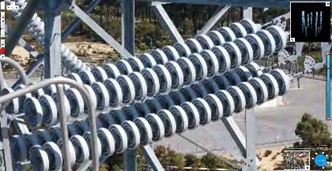
Deep learning models perform well when the data used to train the model is of a high standard, and has been labeled correctly in the first instance. There are elements of deep learning models using re-en- forcement training among other things, but the first step to correctly deploying deep learning and data analytics is to ensure the data captured is of a sufficiently high quality. A poorly trained deep learning model will create additional challenges with false positives and incorrectly identified aspects requiring re-training.
 </p>
</p>
 </div>
Once the data has been captured, and the AI trained, condition based risk monitoring scores and out- puts can be created, identifying potential risks, and hazards to the network, and allowing maintenance planners to better create maintenance schedules. This is similar to the work being conducted for Broadcast Australia.
LIDAR</h5>
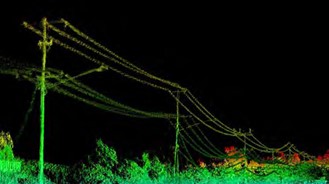
LiDAR and photogrammetry both have their strengths and weaknesses – depending on the system to be used. LiDAR uses light puls-es emitted from a rotating sensor, and then measures the time taken for a return to reach the sensor. As the speed of light is a known figure, then the distance to an object can be calculated. From this, an XYZ co-ordinate can be applied to that point. The LiDAR sensor is capable of capturing nearly a million points per second. From this a detailed point cloud can be generated.
An example of a lidar captured point cloud is shown in the video below.
LiDAR for power assets can be useful for
• Heavily vegetated areas and identifying vegetation encroachment
• Powerline sag surveys, particularly during hot weather and peak loads
• Complex structures (such as substa-tions)
• Night time operations (as the LiDAR uses a laser scanner as opposed to a camera) then point clouds can be generated during night flights
• Operations which require faster process-ing and turnaround times than imagery. Standard rule for LiDAR processing is 3 times the flying time for data processing. For volumetrics, a point cloud can often be generated immediately after the flight has finished.
• Generally less flying required – a LiDAR overlap on a swath may be around 20% side lap, whereas in imagery 60-70% can be required
• LiDAR is beneficial for picking up thin wires/ structures such as power-lines
PHOTOGRAMMETRY</h5>
Photogrammetry is progressing at an ex- tremely rapid rate, allowing the creation of complex datasets in the form of 3D Models, Point clouds, Orthomosaics, DTM’s and DSM’s to be created from standard imagery, provid-ed enough overlap is captured. Photogram- metry does require large amounts of overlap between subsequent images, and longer pro-cessing times.
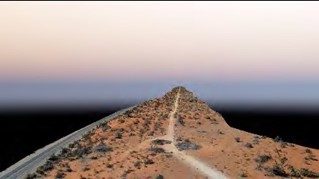
An example of a photogrammetry derived pipeline point cloud is shown in the video be- low.
The advantages of photogrammetry are –
• Point clouds can be generated, however these point clouds are colourised with the pixel data captured by the camera. This is an advantage over the height returns or intensity returns shown by a Lidar alone.
• Raw imagery can also be used for condi-tion reporting
• Colourised products such as Orthomosia-ics and 3D Meshes can be generated
• Can also be used for measurement of vol-umetrics and other data either using the point cloud, DTM, or DSM
• Easier to identify objects in the point cloud due to the colourization
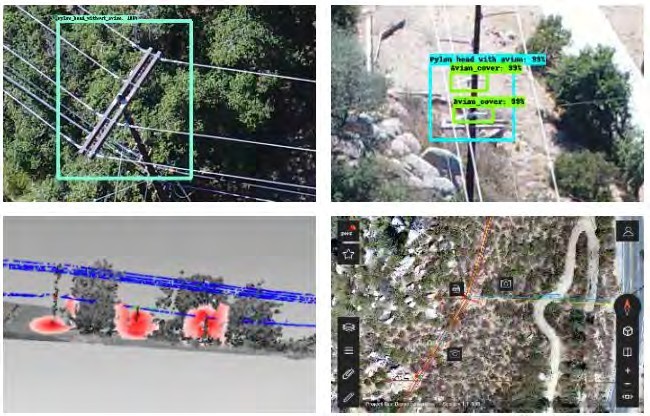
CASE STUDYPwC worked with California’s leading power and utilities company, deploying a combination of remotely piloted aircraft, machine learning, and advanced image data analytics. Smart Data has entered into a Joint Business Relationship with PwC in Australia to co-market our services. The idea behind the project was to reduce the number of outages and operational issues related to vegetation management and encroachment and also increase the effectiveness of their asset man-agement.
Whilst no figures in terms of efficiencies are available the following tangible benefits were realised.</td> </tr> </thead> </table>
|
 </p>
</p>