
Needless waiting is annoying. It gets in the way of what we're trying to do, and slows everything down. This is especially true for computer applications. There are few things worse than being met with a splash screen that loads endlessly when you are trying to get something done, or working with an application that doesn't react immediately to mouse or keyboard input. An application that does this is said to lag, using the colloquial term for latency that has become part of our everyday vocabulary. For commercial web sites, making customers wait needlessly results in a measurable loss of customer business, as Google and Amazon first discovered almost 20 years ago. Since then, several more recent studies unsurprisingly indicate we haven't gotten any more patient in the intervening decades.
One fundamental limit for how long we need to wait on any networked application is network latency: The time it takes for a network packet to traverse the network. Many factors affect latency, including distance, media serialization delay, buffering, and so on, which add up to the total end-to-end latency.
For most network applications (which do not need to transfer large amounts of data) network latency matters far more than bandwidth for the end-to-end service time. While there's still much work to be done to reduce network latency across all our networks, thanks to the phenomenal work of Dave Täht and many of his collaborators at the Bufferbloat project, we now have good solutions to prevent some of the worst network latency issues (getting people to actually use those solutions is another matter though).
However, from the point when an application writes data into its socket until the data can be consumed on the opposite end of the connection, the total end-to-end latency doesn't only depend on the network. When a network packet arrives at the network interface on its destined host, the packet data still must be transferred from the network card to the CPU, pass through the kernel's network stack to be queued on the correct socket, and then actually read from the socket by the application. Intuitively, this local host latency should be minuscule compared to the tens to hundreds of milliseconds it may take a network such as the internet to deliver the packet itself, but that's not always the case. In some cases, the Linux kernel can add substantial latency on the local host.
With eBPF, it is possible to peek deep inside the kernel and monitor this latency. We developed a small monitoring tool called netstacklat to do this.
What is netstacklat?
The netstacklat utility is an eBPF powered monitoring tool that keeps track of how long received packets sit around in the Linux network stack before they're actually read by a receiving application. eBPF lets us attach code to mostly any point within the kernel with very low overhead, which means we can inspect packets at various points as they traverse the network stack.
The core idea behind how to turn these hook points into a latency measurement originally came from Jesper Dangaard Brouer: If any application socket requests to receive software timestamps for incoming packets with SOF_TIMESTAMPING_RX_SOFTWARE, the kernel will, early on in the network stack, record a timestamp and attach it to each packet. As long as any socket requests timestamps, all packets will be timestamped by the kernel, so whenever one of our eBPF programs run, we can determine how long it took for the packet to reach that point (relative to the early part in the stack when it was timestamped) by simply calculating the difference between the current time and the timestamp recorded in the packet, without having to keep any other state, or track the packets in other ways.
Specifically, netstacklat can track the time between when the packet entered the kernel and was timestamped, up to one of the following points (as output by the utility itself):
$ netstacklat --list-probes
available hooks:
  ip-start: packet has reached the IP-stack, i.e. past the traffic control layer
  tcp-start: packet has reached the local TCP-stack, i.e. past the IP (and routing) stack
  udp-start: packet has reached the local UDP-stack, i.e. past the IP (and routing) stack
  tcp-socket-enqueued: packet has been enqueued to a TCP socket, i.e. end of the kernel receive stack
  udp-socket-enqueued: packed has been enqueued to a UDP socket, i.e. end of the kernel receive stack
  tcp-socket-read: packet payload has been read from TCP socket, i.e. delivered to user space
  udp-socket-read: packet payload has been read from UDP socket, i.e. delivered to user space
To illustrate what this means, Figure 1 shows the packet path of the Linux kernel.
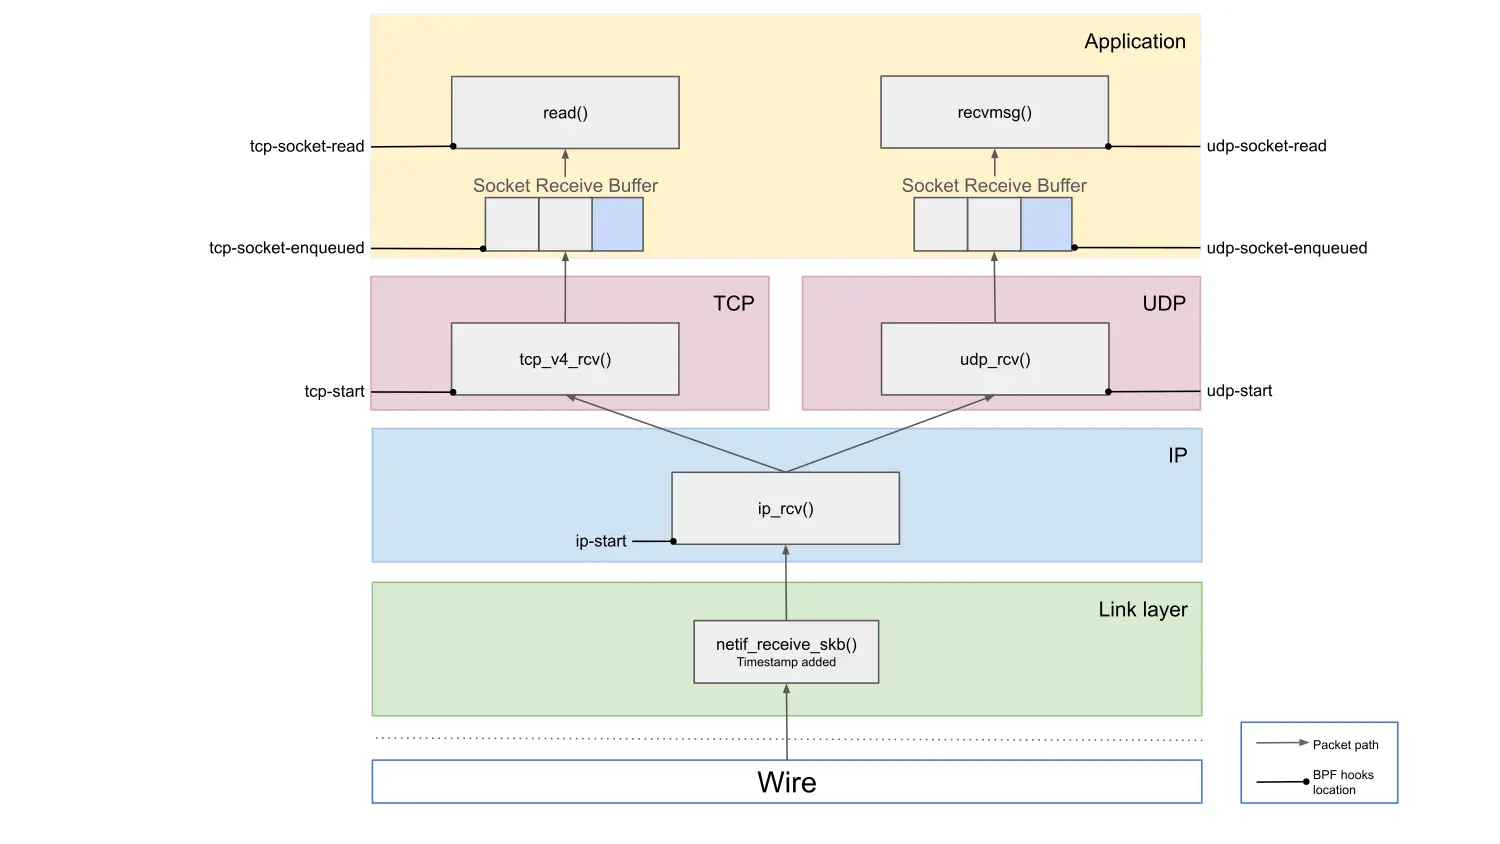
By working through the diagram from the top, we can identify where any latency issues might originate. As an example, let's focus on the TCP path. If the tcp-socket-read latency is high, we know there's added latency somewhere in the kernel. If the tcp-socket-enqueued latency is low at the same time, then the latency happens between those two points, meaning that it's due to an application that is taking a long time to read the data after it's been delivered to the socket. This could either be an issue with the application itself, or simply that the application is waiting on being scheduled to run on the CPU. If, on the other hand, both tcp-socket-read and tcp-socket-enqueued show high latency, it must be coming from somewhere earlier in the path. If the issue is between tcp-socket-enqueued and tcp-start, the TCP layer processing is slow, and if it's between ip-start and tcp-start, then the latency is added at the IP layer, for example by the Netfilter firewall subsystem. Comparing latency readings from different hook points allows us to pinpoint where in the stack the latency is added.
Directly exposing all of the individual latency values would quickly produce an impractical amount of monitoring data. Instead, netstacklat aggregates latency values for each probe point. To capture the distribution of the latency over the often wide range of possible values (from a few nanoseconds to whole seconds), we use exponential histograms with base 2 (each bin is twice as wide as the previous one). This gives a compact but very coarse representation of the entire latency distribution, allowing us to approximate any percentile over any time range. It's not be suitable for detecting small changes, like that optimization you've been hacking away on that reduces latency by 3%. It does, however, work great for detecting when your 99th percentile jumps from a handful of microseconds to multiple seconds.
The netstacklat utility can be run as a command-line tool to interactively debug a running system. For more long term monitoring, it can also be run continuously with ebpf_exporter, exporting its metrics to Prometheus.
A small netstacklat demo
To see how netstacklat can be used in practice, let's walk through a small latency analysis. Everyone likes pi, so we've set up an nginx server that serves a small (10 kB) web page containing the first 10,000 digits of pi. Given the popularity of pi, we want to know whether this nginx setup will be able to handle 15,000 requests per second (RPS). To test this, we run a load test against an nginx server using oha, while simultaneously monitoring it with netstacklat.
$ oha -c 1000 -q 15000 -z 2m -w --no-tui -u ms http://10.70.2.1:4242/pi_10k.html
Summary:
  Success rate:    100.00%
  Total:    120124.1787 ms
  Slowest:    24985.3176 ms   # This is terrible!
  Fastest:    0.5899 ms       # Some responses were very fast...
  Average:    110.5537 ms     # ...but most weren't
  Requests/sec:    9036.0992
  Total data:    5.28 GiB
  Size/request:    5.10 KiB
  Size/sec:    44.98 MiB
...
Response time distribution:
  10.00% in 72.8764 ms        # 90% of requests slower than this
  25.00% in 83.6575 ms
  50.00% in 109.0376 ms
  75.00% in 110.9979 ms
  90.00% in 112.0090 ms
  95.00% in 112.4483 ms
  99.00% in 113.6745 ms
  99.90% in 5068.1578 ms
  99.99% in 19294.1297 ms
...
The load test reveals that our setup could only handle about 9,000 RPS. Not only did it fall short in terms of throughput, but looking at the response time distribution we see that most requests took at least 70ms and a median of 109ms. Response times over 100ms would perhaps be acceptable if this was cross-Atlantic traffic, but in this case we're running the load test from a machine directly connected to the server with a 100Gbps link, so clearly the network latency shouldn't be the problem. A few requests even took longer than 10 seconds, and any pi fan who had to suffer through that will probably find their pi digits at someone else's site in the future.
Looking at the host latency recorded by netstacklat on the server, we see:
$ sudo netstacklat -i ens3f1
...
Fri Sep 19 17:51:48 2025
ip-start:
(128ns, 256ns]       373301 |@@@@@@@@@@@@@                                   |
(256ns, 512ns]      1408476 |@@@@@@@@@@@@@@@@@@@@@@@@@@@@@@@@@@@@@@@@@@@@@@@@|
(512ns, 1.02us]      737185 |@@@@@@@@@@@@@@@@@@@@@@@@@                       |
(1.02us, 2.05us]     100733 |@@@                                             |
(2.05us, 4.1us]        2141 |                                                |
(4.1us, 8.19us]         263 |                                                |
(8.19us, 16.4us]          0 |                                                |
(16.4us, 32.8us]          0 |                                                |
(32.8us, 65.5us]          1 |                                                |
count: 2622100, average: 463.20ns

tcp-start:
(32.8us, 65.5us]    1995010 |@@@@@@@@@@@@@@@@@@@@@@@@@@@@@@@@@@@@@@@@@@@@@@@@|
(65.5us, 131us]      511101 |@@@@@@@@@@@@                                    |
(131us, 262us]       106816 |@@@                                             |
(262us, 524us]         9173 |                                                |
count: 2622100, average: 78.79us

tcp-socket-enqueued:
(32.8us, 65.5us]     589134 |@@@@@@@@@@@@@@@@@@@@@@@@@@@@@@@@@@@@@@@@@@@@@@@@|
(65.5us, 131us]      413086 |@@@@@@@@@@@@@@@@@@@@@@@@@@@@@@@@@@              |
(131us, 262us]        77091 |@@@@@@                                          |
(262us, 524us]         7604 |@                                               |
(524us, 1.05ms]           2 |                                                |
count: 1086917, average: 96.43us

tcp-socket-read:
(131us, 262us]            2 |                                                |
(262us, 524us]            6 |                                                |
(524us, 1.05ms]          23 |                                                |
(1.05ms, 2.1ms]          25 |                                                |
(2.1ms, 4.19ms]          47 |                                                |
(4.19ms, 8.39ms]         83 |                                                |
(8.39ms, 16.8ms]        314 |                                                |
(16.8ms, 33.6ms]        638 |                                                |
(33.6ms, 67.1ms]      67452 |@@@                                             |
(67.1ms, 134ms]     1015312 |@@@@@@@@@@@@@@@@@@@@@@@@@@@@@@@@@@@@@@@@@@@@@@@@|
(134ms, 268ms]           12 |                                                |
(268ms, 537ms]           31 |                                                |
(537ms, 1.07s]           50 |                                                |
(1.07s, 2.15s]           97 |                                                |
(2.15s, 4.29s]          187 |                                                |
(4.29s, 8.59s]          509 |                                                |
(8.59s, inf s]          666 |                                                |
count: 1085454, average: 109.84ms
The tcp-socket-enqueued values tells us that the requests reach the receiving TCP sockets in less than 131us most of the time, with some taking up to 1ms. Looking at the tcp-socket-read data though, we see that in most cases it takes somewhere between 67 to 134ms before nginx actually reads the request. There's also a small fraction of entries in the multi-second region, reflecting the high 99.9 percentiles it was reporting. So almost all of the end-to-end request response time reported by oha here stems from waiting on nginx to actually process the requests.
This means that our nginx setup was not up to the task, and was severely overloaded when trying to handle 15,000 RPS. So let's try to scale it by increasing the number of nginx workers on the server from 2 to 6:
$ oha -c 1000 -q 15000 -z 2m -w --no-tui -u ms http://10.70.2.1:4242/pi_10k.html
Summary:
  Success rate:    100.00%
  Total:    120019.2298 ms
  Slowest:    158.6562 ms
  Fastest:    0.2652 ms
  Average:    1.3982 ms
  Requests/sec:    14997.5300
  Total data:    8.75 GiB
  Size/request:    5.10 KiB
  Size/sec:    74.66 MiB
...
Response time distribution:
  10.00% in 0.4654 ms
  25.00% in 0.6486 ms
  50.00% in 0.9511 ms
  75.00% in 1.5204 ms
  90.00% in 2.1827 ms
  95.00% in 2.7314 ms
  99.00% in 5.0613 ms
  99.90% in 55.1591 ms
  99.99% in 88.2708 ms
...
The netstacklat output:
$ sudo netstacklat -i ens3f1
...
Fri Sep 19 17:55:56 2025
ip-start:
(128ns, 256ns]       416363 |@@@@@@@@@@                                      |
(256ns, 512ns]      1960357 |@@@@@@@@@@@@@@@@@@@@@@@@@@@@@@@@@@@@@@@@@@@@@@@@|
(512ns, 1.02us]     1599772 |@@@@@@@@@@@@@@@@@@@@@@@@@@@@@@@@@@@@@@@         |
(1.02us, 2.05us]     540108 |@@@@@@@@@@@@@                                   |
(2.05us, 4.1us]       26613 |@                                               |
(4.1us, 8.19us]        8547 |                                                |
(8.19us, 16.4us]          3 |                                                |
(16.4us, 32.8us]          0 |                                                |
(32.8us, 65.5us]          1 |                                                |
count: 4551764, average: 596.68ns
tcp-start:
(32.8us, 65.5us]    2985648 |@@@@@@@@@@@@@@@@@@@@@@@@@@@@@@@@@@@@@@@@@@@@@@@@|
(65.5us, 131us]     1018633 |@@@@@@@@@@@@@@@@                                |
(131us, 262us]       480952 |@@@@@@@@                                        |
(262us, 524us]        66530 |@                                               |
(524us, 1.05ms]           1 |                                                |
count: 4551764, average: 89.58us
tcp-socket-enqueued:
(32.8us, 65.5us]     637278 |@@@@@@@@@@@@@@@@@@@@@@@@@@@@@@@@@@@@@@@@@       |
(65.5us, 131us]      743314 |@@@@@@@@@@@@@@@@@@@@@@@@@@@@@@@@@@@@@@@@@@@@@@@@|
(131us, 262us]       377210 |@@@@@@@@@@@@@@@@@@@@@@@@                        |
(262us, 524us]        43755 |@@@                                             |
(524us, 1.05ms]           3 |                                                |
count: 1801560, average: 109.30us
tcp-socket-read:
(32.8us, 65.5us]          2 |                                                |
(65.5us, 131us]       89619 |@@@@@@@@                                        |
(131us, 262us]       244998 |@@@@@@@@@@@@@@@@@@@@@@                          |
(262us, 524us]       457758 |@@@@@@@@@@@@@@@@@@@@@@@@@@@@@@@@@@@@@@@@@       |
(524us, 1.05ms]      532210 |@@@@@@@@@@@@@@@@@@@@@@@@@@@@@@@@@@@@@@@@@@@@@@@@|
(1.05ms, 2.1ms]      355492 |@@@@@@@@@@@@@@@@@@@@@@@@@@@@@@@@                |
(2.1ms, 4.19ms]       98446 |@@@@@@@@@                                       |
(4.19ms, 8.39ms]       8798 |@                                               |
(8.39ms, 16.8ms]       3242 |                                                |
(16.8ms, 33.6ms]       4861 |                                                |
(33.6ms, 67.1ms]       4266 |                                                |
(67.1ms, 134ms]         252 |                                                |
(134ms, 268ms]           48 |                                                |
count: 1799992, average: 1.02ms
Much better! We're able to hit our goal of 15,000 RPS, plus most requests are now only stuck 0.5-2ms in the socket, resulting in much more acceptable response times. Notably, not a single pi fan had to wait longer than the blink of an eye (100-400ms), so hopefully they'll stick around when we launch our big 100,000 digits update.
From tcp-data-enqueued we still see that it takes many requests upwards of 100us to even reach the TCP socket, though. That's pretty long for just getting through the network stack, even if it's relatively small compared to the end-to-end latency here. So what's going on here?
As mentioned above, one contender for pre-TCP processing latency is the netfilter firewall. And upon careful investigation of our system, we do indeed find that someone left 10,000 redundant nftables rules installed on the system! Getting rid of those rules and running the test again, we get:
$ sudo netstacklat -i ens3f1
...
Fri Sep 19 18:01:44 2025
ip-start:
(64ns, 128ns]          7838 |                                                |
(128ns, 256ns]      1311529 |@@@@@@@@@@@@@@@@@@@@@@@@@@@@@@@@@@@@@@@@@@@     |
(256ns, 512ns]      1040226 |@@@@@@@@@@@@@@@@@@@@@@@@@@@@@@@@@@              |
(512ns, 1.02us]     1479524 |@@@@@@@@@@@@@@@@@@@@@@@@@@@@@@@@@@@@@@@@@@@@@@@@|
(1.02us, 2.05us]     468536 |@@@@@@@@@@@@@@@                                 |
(2.05us, 4.1us]       64741 |@@                                              |
(4.1us, 8.19us]        1591 |                                                |
(8.19us, 16.4us]          0 |                                                |
(16.4us, 32.8us]          0 |                                                |
(32.8us, 65.5us]          0 |                                                |
(65.5us, 131us]           0 |                                                |
(131us, 262us]            0 |                                                |
(262us, 524us]            4 |                                                |
count: 4373989, average: 556.04ns
tcp-start:
(256ns, 512ns]          130 |                                                |
(512ns, 1.02us]     1411946 |@@@@@@@@@@@@@@@@@@@@@@@@@@@@@@@@@@@@@@@         |
(1.02us, 2.05us]    1754917 |@@@@@@@@@@@@@@@@@@@@@@@@@@@@@@@@@@@@@@@@@@@@@@@@|
(2.05us, 4.1us]      542449 |@@@@@@@@@@@@@@@                                 |
(4.1us, 8.19us]      497320 |@@@@@@@@@@@@@@                                  |
(8.19us, 16.4us]     165050 |@@@@@                                           |
(16.4us, 32.8us]       2153 |                                                |
(32.8us, 65.5us]          5 |                                                |
(65.5us, 131us]           1 |                                                |
(131us, 262us]            0 |                                                |
(262us, 524us]           16 |                                                |
count: 4373987, average: 2.30us
tcp-socket-enqueued:
(1.02us, 2.05us]     467063 |@@@@@@@@@@@@@@@@@@@@@@@@@@@@@@@@@               |
(2.05us, 4.1us]      674419 |@@@@@@@@@@@@@@@@@@@@@@@@@@@@@@@@@@@@@@@@@@@@@@@@|
(4.1us, 8.19us]      483964 |@@@@@@@@@@@@@@@@@@@@@@@@@@@@@@@@@@              |
(8.19us, 16.4us]     173312 |@@@@@@@@@@@@                                    |
(16.4us, 32.8us]       2707 |                                                |
(32.8us, 65.5us]          2 |                                                |
(65.5us, 131us]           0 |                                                |
(131us, 262us]            0 |                                                |
(262us, 524us]           15 |                                                |
count: 1801482, average: 4.18us
tcp-socket-read:
(4.1us, 8.19us]         451 |                                                |
(8.19us, 16.4us]     342148 |@@@@@@@@@@@@@@@@@@@@@@@@@@@@@                   |
(16.4us, 32.8us]     112309 |@@@@@@@@@@                                      |
(32.8us, 65.5us]       9747 |@                                               |
(65.5us, 131us]       64952 |@@@@@@                                          |
(131us, 262us]       452851 |@@@@@@@@@@@@@@@@@@@@@@@@@@@@@@@@@@@@@@@         |
(262us, 524us]       557720 |@@@@@@@@@@@@@@@@@@@@@@@@@@@@@@@@@@@@@@@@@@@@@@@@|
(524us, 1.05ms]      244864 |@@@@@@@@@@@@@@@@@@@@@                           |
(1.05ms, 2.1ms]       10993 |@                                               |
(2.1ms, 4.19ms]         750 |                                                |
(4.19ms, 8.39ms]        999 |                                                |
(8.39ms, 16.8ms]       1083 |                                                |
(16.8ms, 33.6ms]       1124 |                                                |
count: 1799991, average: 299.43us
Now we see that almost all requests reach the TCP socket in less than 16us. Interestingly, tcp-socket-read now reveals a bimodal distribution with a fraction of the requests being read in just 8-16us, very close to the time oha takes to just deliver the requests to the sockets, with the rest taking between 100us to 1ms.
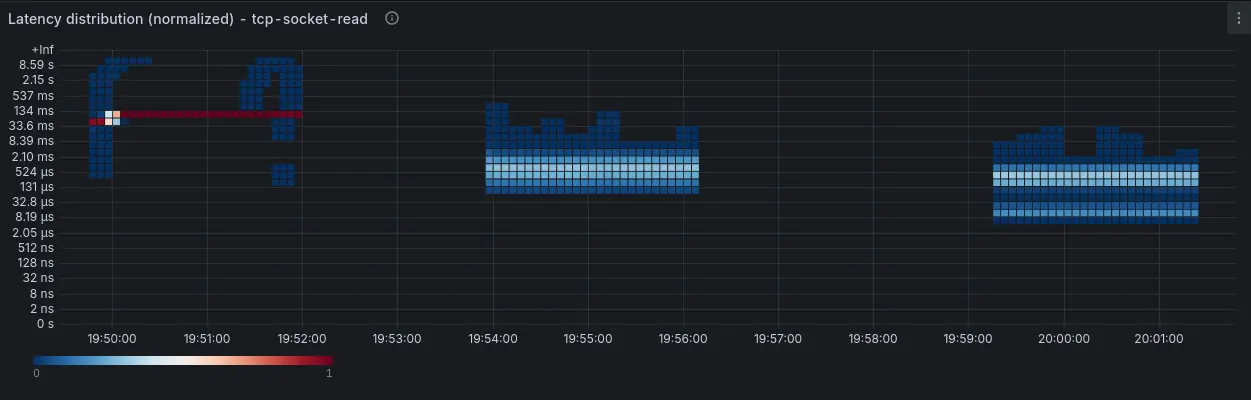
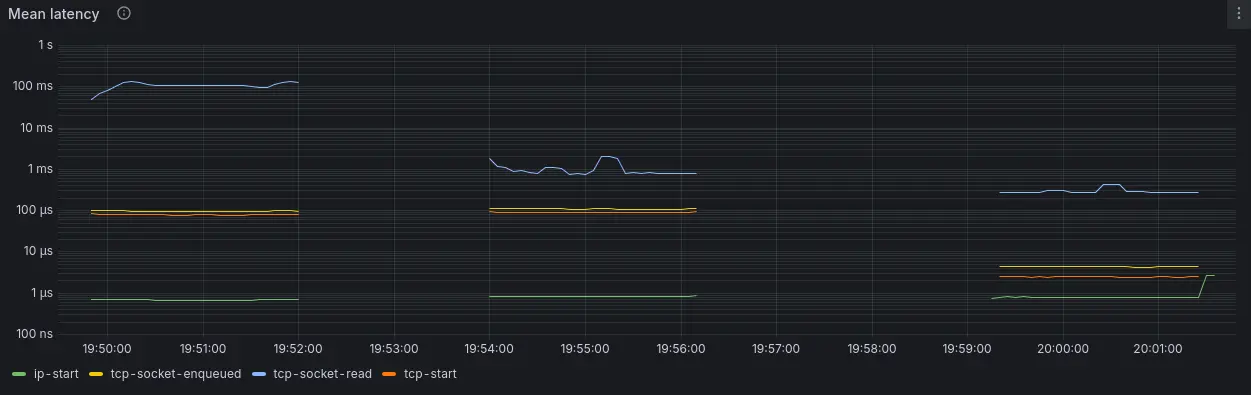
By combining netstacklat with ebpf-exporter, we can visualize the results from these 3 runs, as displayed in Figure 2:
Conclusion
This example shows how netstacklat can help track host network stack latency. With netstacklat, we can determine whether the local host latency makes up a significant part of the end-to-end latency that the test tool itself shows. If run on a production server, monitoring the networking stack latency can serve as a system-wide indicator of performance problems that is not tied to a particular application.
To try out netstacklat on your own system, follow the setup guide.
The post Boosting speed: Use eBPF and netstacklat to troubleshoot latency appeared first on Red Hat Developer.