
Presto UI is a modern, React-based web interface that provides real-time monitoring, query management, and cluster administration capabilities for the Presto distributed SQL query engine. Whether you’re a database administrator, data engineer, or developer, Presto UI offers intuitive tools to visualize query execution, monitor cluster health, and interact with the Presto coordinator.
Key Benefits of Presto UI:
 Real-time Query Monitoring – Track running, queued, and completed queries Cluster Health Dashboard – Monitor worker nodes and resource utilization Interactive SQL Client – Execute queries directly from your browser Performance Analytics – Analyze query execution plans and bottlenecks Resource Management – View memory pools and resource group allocations
Architecture Overview
Technology Stack
The Presto UI leverages a modern JavaScript ecosystem:
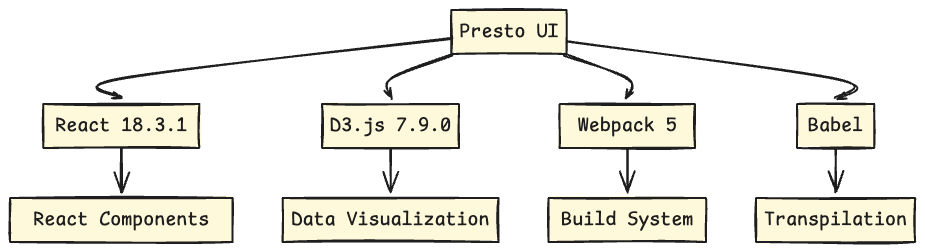
Core Dependencies:
- React 18.3.1: Modern UI framework with concurrent features
- D3.js 7.9.0: Advanced data visualization for query plans and metrics
- dagre-d3-es: Graph visualization for query execution plans
- vis-timeline: Interactive timeline visualizations
- @prestodb/presto-js-client: Official Presto JavaScript client
- react-data-table-component: Efficient data table rendering
- Prism.js: Syntax highlighting for SQL queries
Presto UI Build Configuration
The UI uses a sophisticated Webpack configuration (webpack.config.js) that supports:
- Multiple Entry Points: Separate bundles for different pages (index, query, plan, worker, etc.)
- Code Splitting: Automatic chunking for optimal loading performance
- Development Server: Built-in proxy for API calls during development
- Production Optimization: Terser minification and tree-shaking
Core Components: Understanding Presto UI Features
1. Cluster Overview Dashboard – Real-time Monitoring
The main landing page provides a real-time cluster health dashboard through the ClusterHUD component.
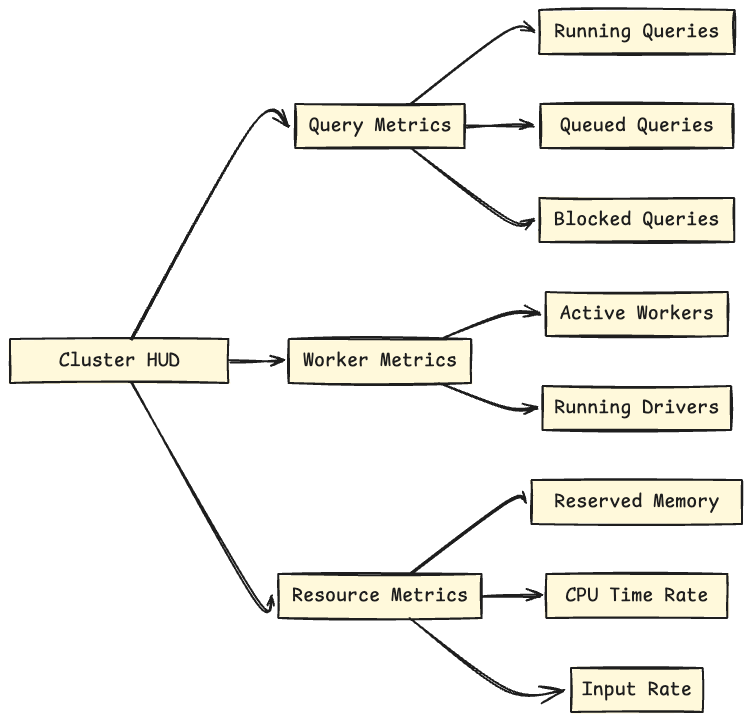
Key Performance Indicators (KPIs):
- Running Queries: Current active query count with trend sparkline
- Queued Queries: Queries waiting for execution resources
- Blocked Queries: Queries unable to progress due to resource constraints
- Active Workers: Number of healthy worker nodes in the cluster
- Running Drivers: Total parallel execution units across all queries
- Reserved Memory: Current memory allocation across the cluster
- Row Input Rate: Rows processed per second (moving average)
- Byte Input Rate: Data throughput in bytes per second
- Worker Parallelism: CPU utilization per worker node
The component uses exponentially weighted moving averages for smooth metric visualization:
// Real-time metric calculation from ClusterHUD.jsx
newRowInputRate = addExponentiallyWeightedToHistory(
    rowsInputSinceRefresh / secsSinceRefresh,
    this.state.rowInputRate
);
Refresh Interval: Updates every 1 second for real-time cluster monitoring.
2. Query List Component
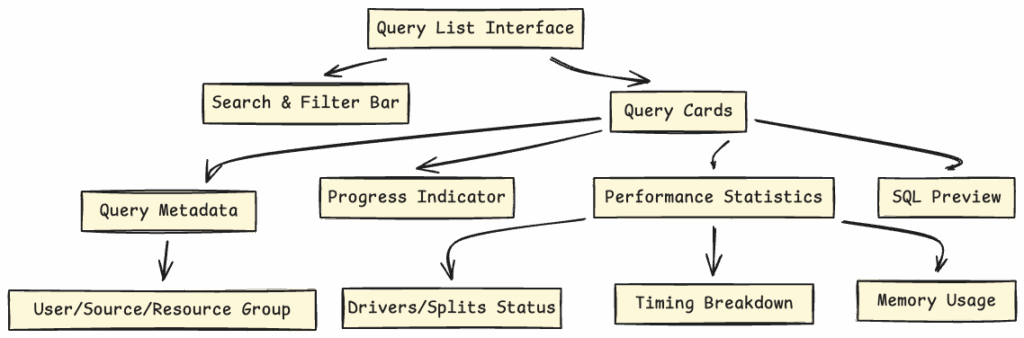
The QueryList component is your command center for managing and monitoring all Presto queries with powerful filtering and sorting capabilities.
How to Monitor Presto Queries:
Advanced Filtering Options:
- State Filters: Running, Queued, Finished queries
- Error Type Filters: Internal Error, External Error, Resources Error, User Error
- Full-text Search: Search across query ID, user, source, resource group, and SQL text
- Real-time Updates: Automatic refresh with configurable intervals (1s, 5s, 10s, 30s)
Query Sorting Capabilities:
- Creation time (newest/oldest first)
- Elapsed time (longest/shortest running)
- CPU time (most/least intensive)
- Execution time (actual processing time)
- Current memory usage
- Cumulative user memory
Comprehensive Query Information Display:
Each query card in the Presto UI shows:
- Query ID: Clickable link to detailed query analysis
- User & Source: Who submitted the query and from which application
- Resource Group: Hierarchical resource allocation (clickable breadcrumb navigation)
- Driver Statistics: Completed, running, and queued drivers/splits
- Timing Metrics: Elapsed time, execution time, CPU time
- Memory Metrics: Current reservation, peak usage, cumulative memory
- Progress Bar: Visual state indicator with color-coded status
- SQL Preview: Formatted query text with intelligent truncation
Pro Tip: Use the search bar to quickly find queries by user, source application, or SQL keywords for faster troubleshooting.
3. Query Detail View
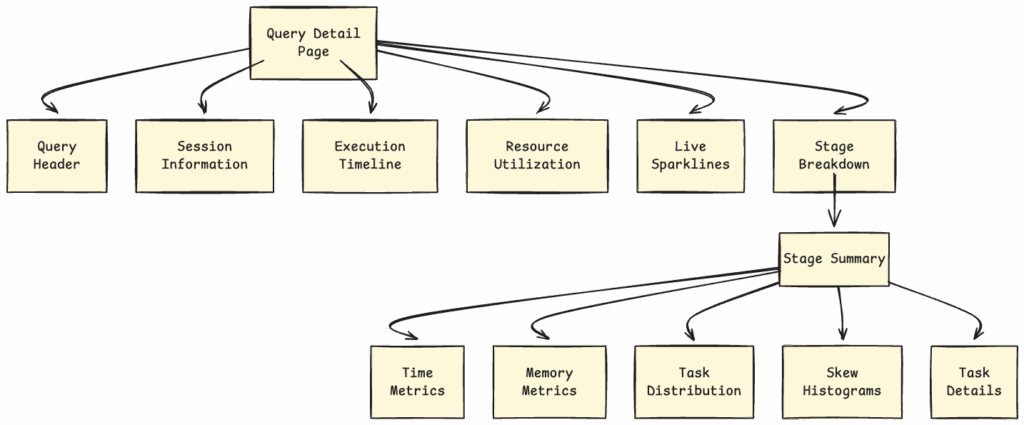
The QueryDetail component provides comprehensive query analysis for performance optimization and debugging.
Understanding Query Execution in Presto UI:
Session Information:
- User identity and principal
- Source application details
- Catalog and schema context
- Client IP address and connection tags
- Session properties and configurations
- Resource estimates and allocations
Execution Timeline Analysis:
- Submission Time: When the query was received
- Completion Time: When execution finished
- Prerequisites Wait Time: Time waiting for dependencies
- Queued Time: Time spent in the queue
- Planning Time: Query optimization duration
- Execution Time: Actual processing time
- Coordinator: Which node coordinated the query
Resource Utilization Metrics:
- CPU Time: Total CPU seconds consumed
- Scheduled Time: Time tasks were scheduled
- Input Rows/Data: Amount of data processed
- Output Rows/Data: Results produced
- Shuffled Data: Data transferred between stages
- Memory Metrics: Peak, cumulative, and current usage
- Spilled Data: Data written to disk (performance indicator)
Real-time Performance Sparklines:
// Live metrics updated every second
- Parallelism: CPU time rate showing query concurrency
- Scheduled Time/s: Task scheduling efficiency
- Input Rows/s: Data ingestion rate
- Input Bytes/s: Network throughput
- Memory Utilization: Current memory consumption
Stage-by-Stage Breakdown:
The Presto UI visualizes query execution stages with:
- Stage Statistics: Time, memory, and task counts per stage
- Task Distribution: Histogram showing task balance across workers
- Skew Analysis: Scheduled time and CPU time distribution
- Expandable Task Lists: Individual task details with filtering
- Auto-Refresh Toggle: Freeze stage view for detailed analysis
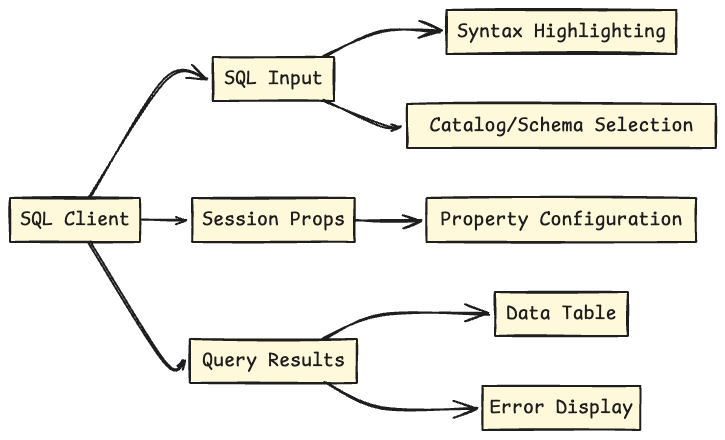
4. Presto SQL Client – Interactive Query Interface
The SQLClient component provides an interactive SQL query interface directly in the browser.
How to Use the Presto SQL Client:
Query Execution Features:
- Syntax-Highlighted Editor: PrismJS-powered SQL editor with auto-formatting
- Catalog Selection: Choose your data source from available catalogs
- Schema Selection: Navigate database schemas easily
- Session Properties: Configure query behavior and optimizations
- Real-time Execution: Submit queries and see results instantly
Results Display:
- Tabular Presentation: Clean, sortable data tables
- Column Sorting: Click headers to sort results
- Export Options: Download results in various formats
- Error Messages: Clear, actionable error information
- Query Statistics: Execution time and row counts
Security Considerations:
The SQL client includes a prominent security warning:
“SQL client directly accesses the coordinator APIs and submits SQL queries. Users who can access the Web UI can use this client to query, update, and even delete data in the catalogs.”
5. Worker Status View – Node-Level Monitoring
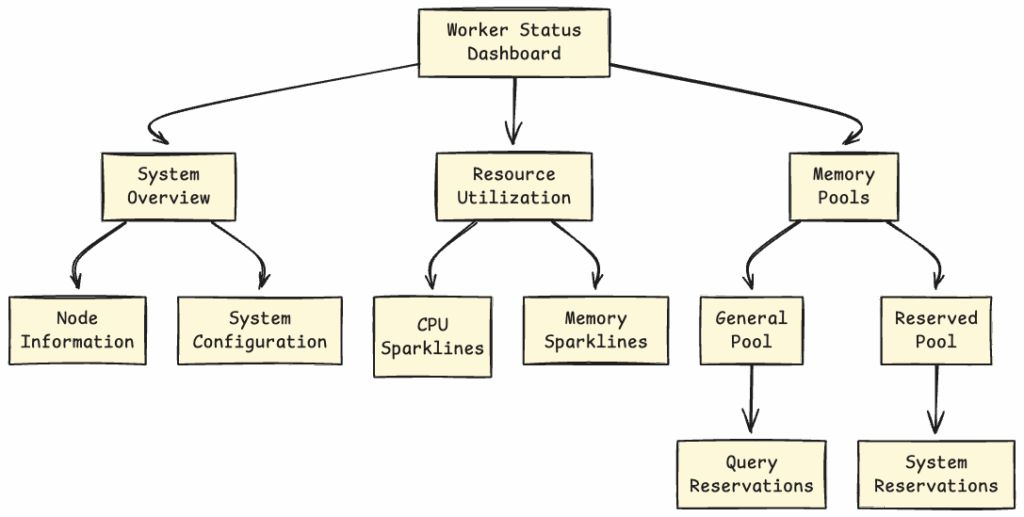
The WorkerStatus component provides detailed monitoring of individual Presto worker nodes.
Worker Node Metrics:
System Overview:
- Node ID: Unique worker identifier
- Heap Memory: Total JVM heap capacity
- Processor Count: Available CPU cores
- Uptime: Time since worker started
- External Address: Public-facing network address
- Internal Address: Cluster-internal network address
Resource Utilization Monitoring:
- Process CPU Utilization: CPU usage by Presto process (sparkline)
- System CPU Utilization: Overall system CPU usage (sparkline)
- Heap Utilization: JVM heap memory percentage (sparkline)
- Non-Heap Memory: Off-heap memory usage (sparkline)
Memory Pool Management:
Presto UI visualizes two critical memory pools:
- General Pool: Memory for query execution
- Total capacity
- Reserved (non-revocable) memory
- Revocable memory
- Free memory
- Per-query breakdown
- Reserved Pool: Memory for system operations
- Same metrics as General Pool
- System-level reservations
- Query-specific allocations
6. Resource Group View
The resource group component provides hierarchical visualization of query resource allocation and management.
7. Query Plan Visualization
The UI includes sophisticated query plan visualization using D3.js and dagre-d3.
Features:
- Interactive DAG (Directed Acyclic Graph) representation
- Stage dependencies and data flow
- Operator-level details
- Zoom and pan capabilities
- Export to various formats
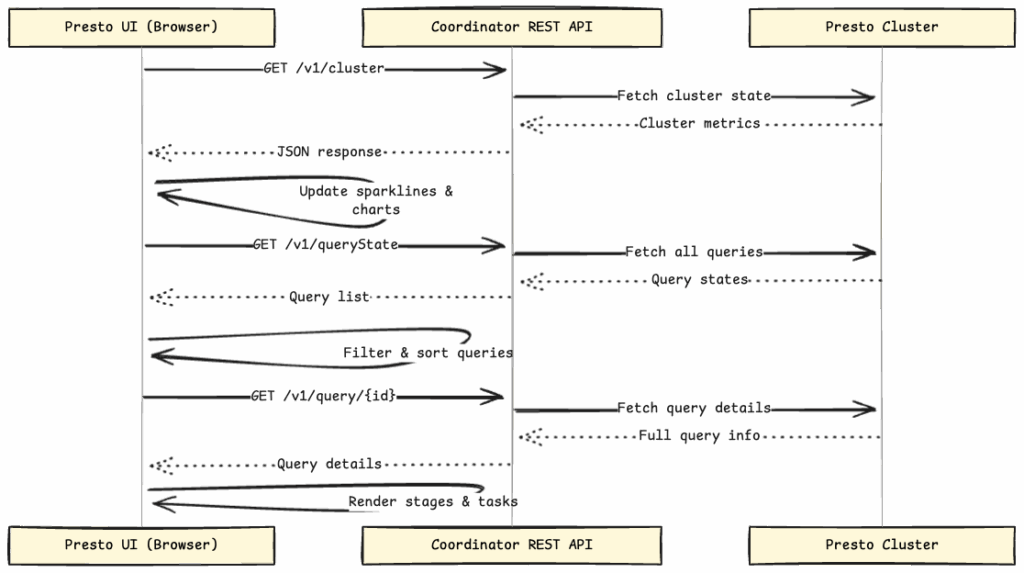
Data Flow Architecture: How Presto UI Communicates
Presto REST API Endpoints
The UI communicates with these key coordinator endpoints:
Cluster Monitoring:
/v1/cluster– Cluster-wide statistics and health metrics/v1/worker/{nodeId}/status– Individual worker node status
Query Management:
/v1/queryState– List of all queries with basic information/v1/query/{queryId}– Detailed query information including stages/v1/taskInfo/{taskId}– Individual task execution details
Resource Management:
/v1/resourceGroupState – Resource group configurations and usage
Performance Optimizations: How Presto UI Stays Fast
1. Lazy Loading
The UI uses a custom lazy loading mechanism (lazy.jsx) for code splitting:
// Components load on-demand
const ClusterHUD = lazy('ClusterHUD');
const QueryList = lazy('QueryList');
const WorkerStatus = lazy('WorkerStatus');
2. Efficient Re-rendering Strategy
Components implement intelligent update strategies:
- Throttled Sparkline Rendering: 1-second minimum interval prevents excessive redraws
- Incremental Query List Updates: Only changed queries re-render
- Conditional Stage Refresh: Auto-refresh toggle for detailed analysis
- Memoized Calculations: Expensive computations cached
3. Data Aggregation Techniques
Moving averages and exponentially weighted calculations:
- Reduce data noise in visualizations
- Smooth out temporary spikes
- Provide accurate trend analysis
- Minimize memory footprint
Deployment Architecture: How to Deploy Presto UI
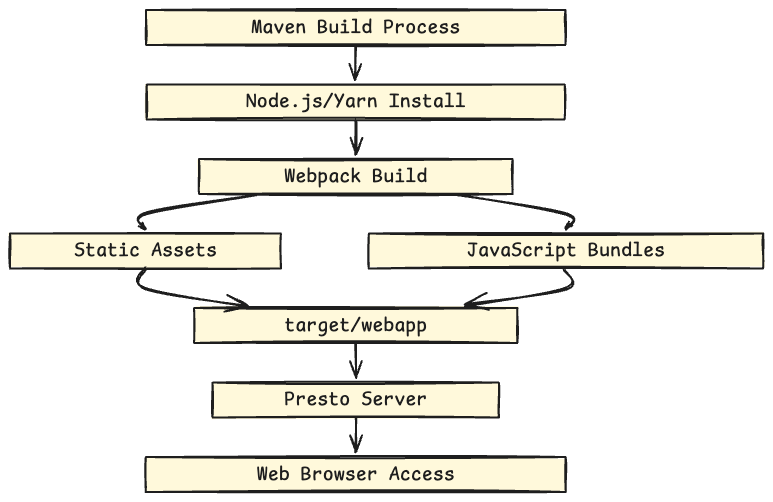
Build Process Steps:
- Maven Trigger:
frontend-maven-plugininitiates build - Node.js Installation: v22.15.1 installed automatically
- Yarn Installation: v1.22.22 for dependency management
- Webpack Bundling: Optimized production bundles created
- Asset Copying: Static files moved to
target/webapp - Server Integration: Presto server serves UI at root path
Ready to Contribute? Start Your Presto UI Journey Today!
Find Your First Frontend Issue
The Presto community welcomes frontend developers of all skill levels! We’ve made it easy to find issues that match your expertise and interests.
Browse WebUI Issues on GitHub
All frontend-related issues are tagged with the webui label for easy discovery:
 View All WebUI Issues on GitHub
Follow Presto at Linkedin, Youtube, and Join Slack channel to interact with the community.
The post Understanding Presto UI: A Deep Dive into the Web Interface Architecture appeared first on PrestoDB.