calendar_today
April 2, 2026
person
Performance Stats Team
domainbackblaze
Cloud performance is easy to claim and hard to measure. As data volumes grow and workloads become more complex, the real question isn’t just how fast a provider is—it’s how that performance holds up in practice, and what you’re actually getting for what you pay.
Our answer to that challenge is Performance Stats, the most recent addition to our Stats franchises, Drive Stats and Network Stats. This ongoing, quarterly report will share performance testing results for both Backblaze and competitors, as well as the testing methodology so that anyone can recreate, compare results, and contribute to building better tests if necessary. (And, as always, we love the healthy debate in the comments section and beyond.)
By sharing the full results—strengths, limitations, anomalies, and more—we’re working to give developers and teams a more complete picture of how cloud storage providers perform in practice. We’re building a dataset over time, and we’re just at the beginning—let’s dive in.
And we can talk about it, too
Join the Performance Stats team on Thursday, April 9, 2026 to go over the stats, talk about testing methodology, and more. Have a question for us? Submit your question ahead of time here.
Q1 2026: The results
We ran performance testing for Backblaze B2, AWS S3, Cloudflare R2, and Wasabi Object Storage in two regions, US-East and the EU-Central. Our EU data center is in Amsterdam, and just like in our first round of testing, we matched the other cloud provider locations as closely as possible. You can jump to the testing methodology if you’d like more details.
Key findings:
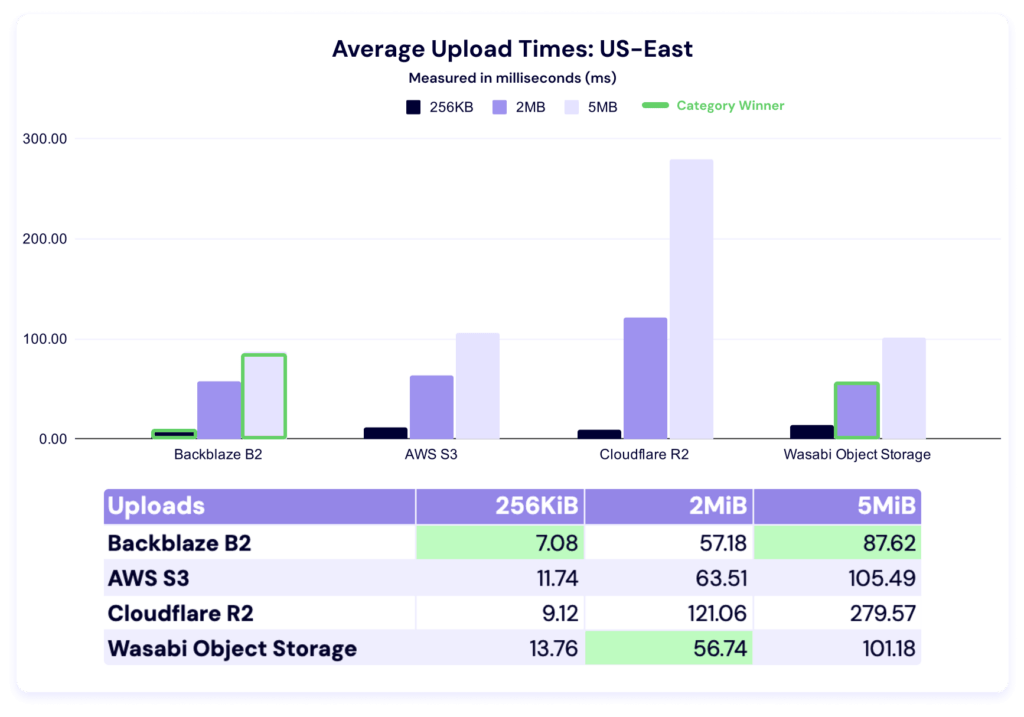
Average upload and download times for US-East improved across nearly all providers and file sizes compared to Q4 2025. Backblaze led in upload averages for 256KiB and 5MiB files, with Wasabi taking the 2MiB category.
Sustained throughput testing continues to tell a different story than averages alone. As with last quarter, the spread between highest and lowest values per file size remains wide—particularly in multi-threaded tests, where providers’ architectural choices show up most clearly.
EU-Central results show meaningful regional variation. Provider rankings shifted between US-East and EU-Central—for example, Cloudflare R2 performed notably well on EU upload and download averages, while Wasabi led in several EU upload throughput categories. The takeaway: geography matters, and no single provider’s US performance predicts their EU performance.
Multi-threaded download tends to see a sharp rate of increase and then level out. In both US-East and the EU and for most of the tested providers, we see a sharp increase in mebibytes per second performance from the 256KiB to 5MiB file size, then a relatively flat trendline thereafter. This is an early trend that has existed quarter-on-quarter, and worth watching over time.
And, here’s a roadmap if you want to quickly reach each test:
We want to cut through the noise on cloud performance, and we’re working to build a transparent dataset to support that. This transparency is also why we’re publishing our testing methodology.
We want to take a hard look at performance on a level playing field for two reasons:
Buyers should know what they’re getting and have the tools to sniff out the hype and misleading messaging many providers peddle about their performance.
If we don’t measure ourselves, we won’t get better. We want you to understand where we’re doing well today, and we want to take you along for the ride as we work to improve where we’re not.
We’ve outlined the methodology at the end of this report. And, across the board, it’s important to note that this project is still young. Young datasets have lots of variability before they show true patterns: So, the best way to understand these results is to re-create them yourselves within your own tech stack.
On the subject of transparency, let’s talk rate limits
From the start, we expected the data to surface both strengths and weaknesses, which is why transparency has to include context—not just raw results. This time around, the thing that was revealed is our rate limits.
At a certain level of scale, cloud storage providers have to implement rate limits to ensure consistent performance and keep the platform secure from intentional or unintentional volumetric attacks. And, we even saw an example of that behavior last quarter in the Wasabi data—in that case, the limit they have in place is that they don’t allow users to run HTTP requests for the first 30 days of a new account period.
Our rate limits work differently. I’m simplifying a bit, but there are three different ways you can trigger a rate limit: too much bandwidth being pushed, too many requests per second, or too many threads running concurrently. On the user’s side, you see either a 429 error (if you’re running our B2 Native API) or a 503 error (if you’re running the S3 compatible API).
We didn’t hit rate limits in all tests. In fact, we only hit them in the multi-threaded throughput tests at the larger file sizes, which indicated to us that we were running into bandwidth caps. And, since throughput testing by nature is a stress test, this is relatively unsurprising. We’re trying to push as much data as possible in a five minute period—if the platform doesn’t know testing is happening, it can look like a volumetric attack.
Now to the sticky part from a reporting perspective: When we set out to write this report, the testing methodology includes the parameter that we’d test standard account tiers. In practice, we actually have no control over whether our testing accounts are being treated differently on the back-end with other providers, for better (preferential treatment) or worse (throttling). That’s also why we run testing from an independent Vultr server—it means we aren’t using a Backblaze-owned IP address, so the testing account isn’t identifiable by other providers. The accounts are being judged on their behavior.
So what do we do here? How do we balance testing against real world behavior? We decided to show you what it looks like when you hit rate limits and outline some potential steps for user-side mitigation.
On every cloud storage platform, we can expect that there are default rate limits applied. When we saw our own, we had the advantage of knowing that that’s what we were seeing—if we were in the real world, we’d do additional investigation to confirm. From a testing perspective, we went forward in a way that would be the most likely scenario in the real world: We incorporated an auto-retry script.
In all cases for this report, we were hitting bandwidth caps at the larger file sizes in the multi-threaded throughput tests. So, if the test tried and failed, we raised that limit and only that limit—all other account parameters stayed in line with the default standard account. In the real world, you would have completed your investigation, then reached out to Support to raise bandwidth caps, which would then apply to your account going forward.
There are actions you can take before requesting a change, especially because sometimes API calls are failing for other reasons. So it’s helpful to do things like retry with exponential backoff, double check your lifecycle rules and other automated processes (especially sequential operations), increase or decrease thread count, change file size, etc., and keep all the logs, too. Sometimes just those things will solve the issues you need to solve.
More importantly, all of those actions are things that will give you more information about what type of configuration issues you’re having, and, if you are running into a rate limit issue, (at least with us) you can request a specific configuration change. For example, in this case, we only raised the bandwidth cap, and kept all the other account configuration variables in line with our standard tier. Our concern was to keep the testing as fair and consistent as possible. But, in a real-world scenario, that may mean you’d avoid something like jumping into a different pricing tier. In all cases and with all providers, testing and communication are key at this stage. Data, as always, is king.
Back to this report: we have two important impacts. First, we can’t confidently make quarter over quarter comparisons this time around because we’ve changed the testing methodology (though we can do so in our upload and download averages, as they weren’t affected). We may point out observational patterns, but we can’t say they’re significant. And hey, the dataset is young—we shouldn’t be doing that yet anyway. Second, if we hit a rate limit, we went ahead and included that data as a separate line item in our tables—so I’ve updated our testing methodology accordingly.
With that out of the way, let’s get into the report.
US-East
This quarter, we’ve added a second region to our reporting. We’ll start with US-East, then move to EU-Central.
Upload comparisons
This test shows the average time in milliseconds it takes to upload a file. Averages were taken across a month of data and for three different file sizes.
In these tests, a lower result is better, and as with the last report, we’ve highlighted the category winners in green for readability.